
Archive last synchronized 2026-09-17 — latest addition: The Roswell Incident. Congressional testimony from David Grusch, Colonel Karl Nell, and former Under Secretary of Defense Dr. Ronald Moultrie is documented alongside the primary sources in the Vault.
The Credibility Ledger
Every one of the 362 live case files on this site carries a public, numeric score — argued case by case in its own "Why this stamp" section, never templated. 9 Verified, 63 Credible, 217 Disputed, 41 Open, 28 Debunked, 4 Personal.
Five Observables, Site-Wide
Across the 358 live cases with a completed Five Observables Assessment, here is how often each anomalous characteristic is actually recorded as present — not assumed.
Every Case, Figure, and Book — One Graph
Every case file, key figure, location, theory, ancient entry, and Essential Reading book on this site, mapped as one explorable relationship graph — click through any node straight into its own record, or search to jump directly to one.
Every Case, Every Dataset, One Map
362 curated case files always render on top, layered over four independent raw datasets you can toggle on or off — with a density heatmap, per-source filters, and deep links straight from a map point into its own record on this site.
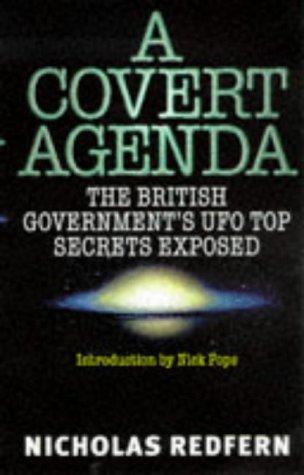
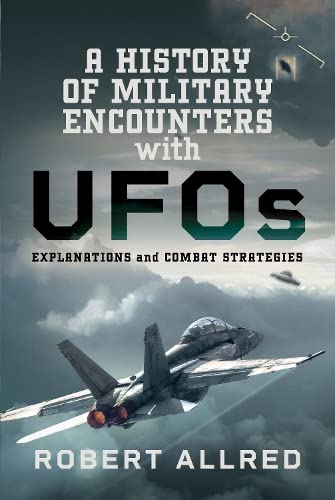
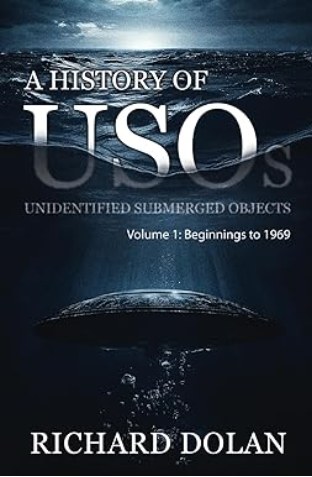
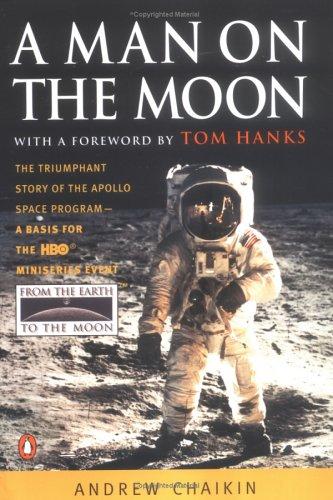
In-Depth Book Breakdowns
445 book-length breakdowns — real research, real cover art, verified sources, and full cross-referencing back into this site's own case files and key figures. No filler, no AI-generated summaries.



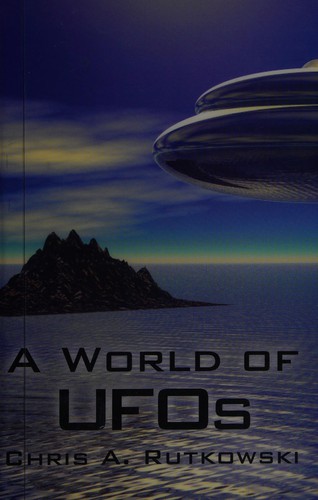
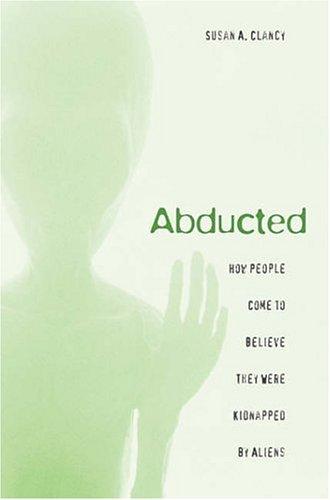
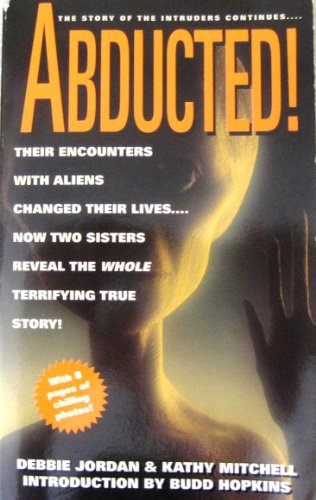
Data Exclusives
Three pieces of original data journalism, built entirely from this site's own datasets and correlation network — not summarized from someone else's reporting.
The Summer Peak & the April Myth
We ran all 147,585 NUFORC sightings through our own live database. The April anomaly is a myth. July is the real peak — and one year breaks the entire model. Original data journalism from OverClassified.
Cross-Referenced: Four Patterns Hidden in Our Own Data
We cross-referenced every case file's score, observables, and theory-alignment data against the correlation network and the NUFORC database. Six patterns survived scrutiny — including a 14.2× independent spike in raw civilian reports at the exact state and month of the Phoenix Lights.
Water Proximity Analysis
We computed the real, GIS-based distance from every case file and location on this site to its nearest ocean, sea, lake, or river using actual survey data — not estimates. Perpetually updated as new cases are added.
The Data Series Synthesis
All seven OverClassified data exclusives, side by side, cross-referenced against NUFORC and GEIPAN — what replicates, what's debunked, what's confounded, and what's still data-limited.
Nuclear Facility Proximity Analysis
We computed the real distance from every case file and location on this site to its nearest ICBM field, weapons lab, SSBN base, test range, or power plant using a source-cited facility list — not estimates. Perpetually updated as new cases are added.
Bolide & Fireball Proximity Analysis
We checked every case file against NASA JPL's real, public fireball/bolide event data — matched by time, not just distance. The result: almost no genuine coincidences, even in the best matches.
Lunar & Atmospheric Conditions Analysis
We computed the real moon phase, historical weather (ERA5 reanalysis), and nearest-airport distance for every case file on this site — not estimates. Most sightings happened under overcast skies, not clear ones.
Population Density Control Analysis
We computed the real correlation between population density and this site's own Water and Nuclear Facility proximity findings using official GeoNames city data — turning an asserted caveat into an actual tested number.
Restricted Military Airspace Proximity Analysis
We computed the real distance from every case file to its nearest restricted military airspace zone — Warning Areas, Restricted Areas, MOAs — the actual aviation-safety angle behind AARO's own stated mandate.
Submarine Cable Proximity Analysis
We computed the real distance from every case file to its nearest submarine cable landing station using TeleGeography's live official data — sharpening this site's long-running USO thread into an actual tested metric.
Solar & Geomagnetic Activity Analysis
We tested the commonly-repeated claim that sightings correlate with solar/geomagnetic activity against real historical data since 1932 — the claim doesn't hold up against this site's own case dates.
Latest Additions
The newest case files added to the archive, sorted by real file modification time — not a hand-maintained list.
The Roswell Incident
509th Bomb Group recovers a "flying disc" — retracted within hours
The Phoenix Lights
Thousands witness mile-wide V-formation — Governor confirms sighting
USS Nimitz / Tic Tac Encounter
Navy pilots track anomalous object on multiple sensor systems
Rendlesham Forest Incident
USAF personnel encounter craft near NATO bases — binary code recorded
NUFORC Sightings Quick Search
Query the local database of 147,585 civilian NUFORC records in real-time. Select a shape or state to test API index lookup rates directly from the homepage.
Explore the Full Archive
Every dataset and index on this site, in one place.
The Vault: A Global Archive
491 real declassified documents across 29 country and agency sections — from the CIA's FOIA reading room to Norway's Project Hessdalen archive. Every link is live-verified before it's added.
🇺🇸Washington DC Radar Sightings
The CIA's own internal assessment of the July 1952 radar incursions over the Capitol — multiple stations tracked objects over restricted airspace and jets were scrambled.
🇫🇷GEIPAN Public UAP Case Database
The most transparent government UAP program in the world — 3,368+ cases with scientific analysis, now fully integrated into this site's own interactive Map.
🇬🇧UK MoD UFO Files — Complete Release
209 files, 52,000+ pages, released 2008–2013 by the National Archives — including original Rendlesham Forest documentation.
🇧🇷Operation Prato Investigation Files
The Brazilian Air Force's classified probe into 500+ "chupa-chupa" beam-weapon encounters at Colares Island — declassified 2004.
The Correlation Network
467 key figures and 272 locations recur across two or more independently researched pages on this site — the same names and places surfacing from unrelated cases, theories, and ancient records. This is the actual correlation signal, tracked in the site's own Master Correlation Network.